Tutorial 3: Making plots and statistics
The cosmosis command runs the CosmoSIS samplers and generates either an output chain file (for most samplers) or a directory (for the test sampler).
The cosmosis-postprocess command knows how to take these files or directories and generate a collection of image and text files describing the chains.
Different samplers produce different kinds of outputs - for example, some produce samples with weights, some require an initial burn-in to be removed, and some like the Fisher Matrix sampler don’t produce samples at all. The postprocess command knows how to deal with each different kind of output.
Running postprocess
The postprocess command should be run on the chain file or test directory that is output by the sampler. In tutorial 2 you ran the emcee sampler and made an output file output/pantheon.txt. Now we can process that command to generate some plots and statistics. Run this command:
cosmosis-postprocess -o output/pantheon output/pantheon.txt --burn 0.3
This will create a group of files in the output/pantheon directory.
The --burn flag specifies the number of samples to remove from the start of the chain - this is required for many MCMC samplers, including emcee. You should examine your chain and cut off any initial portion where the samples have not reach a steady state.
Postprocess outputs: plots
Postprocess produces a collection of plots showing the 1D and 2D parameter contours. Here are some examples:

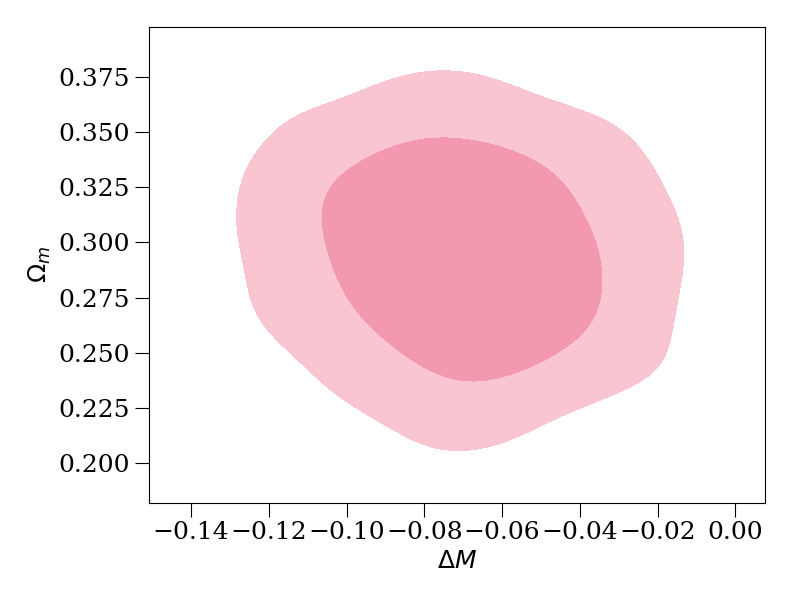
These are estimates of the posterior distribtion of the parameters, smoothed using a Kernel Density Estimation process.
The 2D plots show 68% and 95% credible intervals.
Postprocessing outputs: statistics
Postprocessing also produces text files containing
Multiple plots
You can give the postprocess command two or more chain files and it will produce plots with multiple sets of contours.
In this case you probably want to set the flag --no-fill to make the 2D contours easier to read, and the flag --legend="Chain 1 Name|Chain 2 Name" to add a legend to the plot.
Here is an example comparing chains from the metropolis and emcee samplers, which I made (after making the metropolis chain) using the command:
cosmosis-postprocess output/pantheon.txt output/pantheon_metropolis.txt -o plots -p compare_multinest --burn 0.3 --no-fill --legend="Emcee|Multinest"

Controlling plot output
The 2D plots made using KDE can take some time to generate, especially for large chains. You can avoid making 2D plots altogether using the postprocess flag --no-2d or any plots using --no-plots. The latter can be useful on systems where matplotlib is not available.
You can also select subsets of plots to make using the flags --only=xxx and --either=yyy, which restrict 2D plots to only make plots where both of the parameter names start with xxx and either of them start with yyy.
See the reference page for the postprocess command line for lots more details.